Plot functional space and chosen functional indices
Source:R/plot_alpha_indices.R
alpha.multidim.plot.RdCompute a graphical representation of functional indices. To plot
functional indices, functional indices values must have been retrieve
through the use of the alpha.fd.multidim function.
Usage
alpha.multidim.plot(
  output_alpha_fd_multidim,
  plot_asb_nm,
  ind_nm = c("fide", "fric", "fdiv", "fdis", "feve", "fori", "fspe", "fnnd"),
  faxes = NULL,
  faxes_nm = NULL,
  range_faxes = c(NA, NA),
  color_bg = "grey95",
  shape_sp = c(pool = 3, asb1 = 21, asb2 = 21),
  size_sp = c(pool = 0.7, asb1 = 1, asb2 = 1),
  color_sp = c(pool = "grey50", asb1 = "#0072B2", asb2 = "#D55E00"),
  color_vert = c(pool = "grey50", asb1 = "#0072B2", asb2 = "#D55E00"),
  fill_sp = c(pool = NA, asb1 = "#FFFFFF30", asb2 = "#FFFFFF30"),
  fill_vert = c(pool = NA, asb1 = "#0072B2", asb2 = "#D55E00"),
  color_ch = c(pool = NA, asb1 = "#0072B2", asb2 = "#D55E00"),
  fill_ch = c(pool = "white", asb1 = "#0072B2", asb2 = "#D55E00"),
  alpha_ch = c(pool = 1, asb1 = 0.3, asb2 = 0.3),
  shape_centroid_fdis = c(asb1 = 22, asb2 = 22),
  shape_centroid_fdiv = c(asb1 = 24, asb2 = 25),
  shape_centroid_fspe = 23,
  color_centroid_fspe = "black",
  size_sp_nm = 3,
  color_sp_nm = "black",
  plot_sp_nm = NULL,
  fontface_sp_nm = "plain",
  save_file = FALSE,
  check_input = TRUE
)
Arguments
- output_alpha_fd_multidim
a list of objects retrieved through the
alpha.fd.multidimfunction.- plot_asb_nm
a vector containing name(s) of assemblage(s) to plot.
- ind_nm
a vector of character string of the name of functional indices to plot. Indices names must be written in lower case letters. Possible indices to compute are: "fdis", "feve", "fric", "fdiv", "fori" and "fspe". Default: all the indices are computed.
- faxes
a vector with names of axes to plot. You can only plot from 2 to 4 axes for graphical reasons: vector length should be between 2 and 4. Default: faxes = NULL (the four first axes will be plotted).
- faxes_nm
a vector with axes labels if the user want different axes labels than
faxesones. Default: faxes_nm = faxes (labels will the the same thatfaxesones).- range_faxes
a vector with minimum and maximum for values for axes. Note that to have a fair representation of position of species in all plots, all axes must have the same range. Default: faxes_lim = c(NA, NA) (the range is computed according to the range of values among all axes, all axes having the same range).
- color_bg
a R color name or an hexadecimal code used to fill plot background. Default:
color_bg = "grey95".- shape_sp
a vector gathering numeric values referring to the symbol used to draw species from the global pool and the plotted assemblage(s). It should be written as c(pool = "...", asb1 = "...", ...). (0 = high transparency, 1 = no transparency).
- size_sp
a vector gathering numeric values referring to the size of species belonging to the global pool and the plotted assemblage(s). It should be written as c(pool = "...", asb1 = "...", ...).
- color_sp
a vector gathering R color names or hexadecimal codes referring to the color of species from the global pool and studied assemblage(s). It should be written as c(pool = "...", asb1 = "...", ...).
- color_vert
a vector gathering R color names or hexadecimal codes referring to the color of vertices from the global pool and studied assemblage(s). It should be written as c(pool = "...", asb1 = "...", ...).
- fill_sp
a vector gathering R color names or hexadecimal codes referring to the filled color of species from the global pool and studied assemblage(s). It should be written as c(pool = "...", asb1 = "...", ...).
- fill_vert
a vector gathering R color names or hexadecimal codes referring to the filled color of vertices from the global pool and studied assemblage(s). It should be written as c(pool = "...", asb1 = "...", ...).
- color_ch
a vector gathering R color names or hexadecimal codes referring to the color of the convex pool of the global pool and studied assemblage(s). It should be written as c(pool = "...", asb1 = "...", ...).
- fill_ch
a vector gathering R color names or hexadecimal codes referring to the color to fill the convex pool of the global pool and studied assemblage(s). It should be written as c(pool = "...", asb1 = "...", ...).
- alpha_ch
a vector gathering numeric values referring to the opacity of convex hulls of the global pool and the plotted assemblage(s). It should be written as c(pool = "...", asb1 = "...", ...). (0 = high transparency, 1 = no transparency).
- shape_centroid_fdis
a vector gathering numeric value(s) used to draw FDis centroid size.
- shape_centroid_fdiv
a vector gathering numeric value(s) used to draw FDiv centroid size.
- shape_centroid_fspe
a vector gathering numeric value used to draw FSpe centroid (i.e. center of the functional space) size.
- color_centroid_fspe
a vector gathering R color name or hexadecimal code used to draw FSpe centroid (i.e. center of the functional space) color.
- size_sp_nm
a numeric value referring to the size of species names if plotted.
- color_sp_nm
a R color name or hexadecimal code referring to the color of names of species if plotted.
- plot_sp_nm
a vector containing species names that are to be plotted. Default:
plot_nm_sp = NULL(no name plotted).- fontface_sp_nm
a character string for font of species labels (e.g. "italic", "bold"). Default:
fontface_sp_nm = 'plain'.- save_file
a logical value telling if plots should be locally saved or not.
- check_input
a logical value indicating whether key features the inputs are checked (e.g. class and/or mode of objects, names of rows and/or columns, missing values). If an error is detected, a detailed message is returned. Default:
check.input = TRUE.
Value
If name_file is NULL, it returns a list of one
ggplot2 plots per functional index containing plots for combinations
of up to four axes, a patchwork figure gathering all combinations of
axes and a ggplot2 figure showing the plot caption. If
name_file is not NULL, then those plots are saved locally.
Examples
# \donttest{
# Load Species*Traits dataframe:
data("fruits_traits", package = "mFD")
# Load Assemblages*Species dataframe:
data("baskets_fruits_weights", package = "mFD")
# Load Traits categories dataframe:
data("fruits_traits_cat", package = "mFD")
# Compute functional distance
sp_dist_fruits <- mFD::funct.dist(sp_tr = fruits_traits,
tr_cat = fruits_traits_cat,
metric = "gower",
scale_euclid = "scale_center",
ordinal_var = "classic",
weight_type = "equal",
stop_if_NA = TRUE)
#> [1] "Running w.type=equal on groups=c(Size)"
#> [1] "Running w.type=equal on groups=c(Plant)"
#> [1] "Running w.type=equal on groups=c(Climate)"
#> [1] "Running w.type=equal on groups=c(Seed)"
#> [1] "Running w.type=equal on groups=c(Sugar)"
#> [1] "Running w.type=equal on groups=c(Use,Use,Use)"
# Compute functional spaces quality to retrieve species coordinates matrix:
fspaces_quality_fruits <- mFD::quality.fspaces(sp_dist = sp_dist_fruits,
maxdim_pcoa = 10,
deviation_weighting = "absolute",
fdist_scaling = FALSE,
fdendro = "average")
# Retrieve species coordinates matrix:
sp_faxes_coord_fruits <- fspaces_quality_fruits$details_fspaces$sp_pc_coord
# Compute alpha diversity indices:
alpha_fd_indices_fruits <- mFD::alpha.fd.multidim(
sp_faxes_coord = sp_faxes_coord_fruits[, c("PC1", "PC2", "PC3", "PC4")],
asb_sp_w = baskets_fruits_weights,
ind_vect = c("fdis", "fmpd", "fnnd", "feve", "fric", "fdiv",
"fori", "fspe"),
scaling = TRUE,
check_input = TRUE,
details_returned = TRUE)
#> basket_1 done 10%
#> basket_2 done 20%
#> basket_3 done 30%
#> basket_4 done 40%
#> basket_5 done 50%
#> basket_6 done 60%
#> basket_7 done 70%
#> basket_8 done 80%
#> basket_9 done 90%
#> basket_10 done 100%
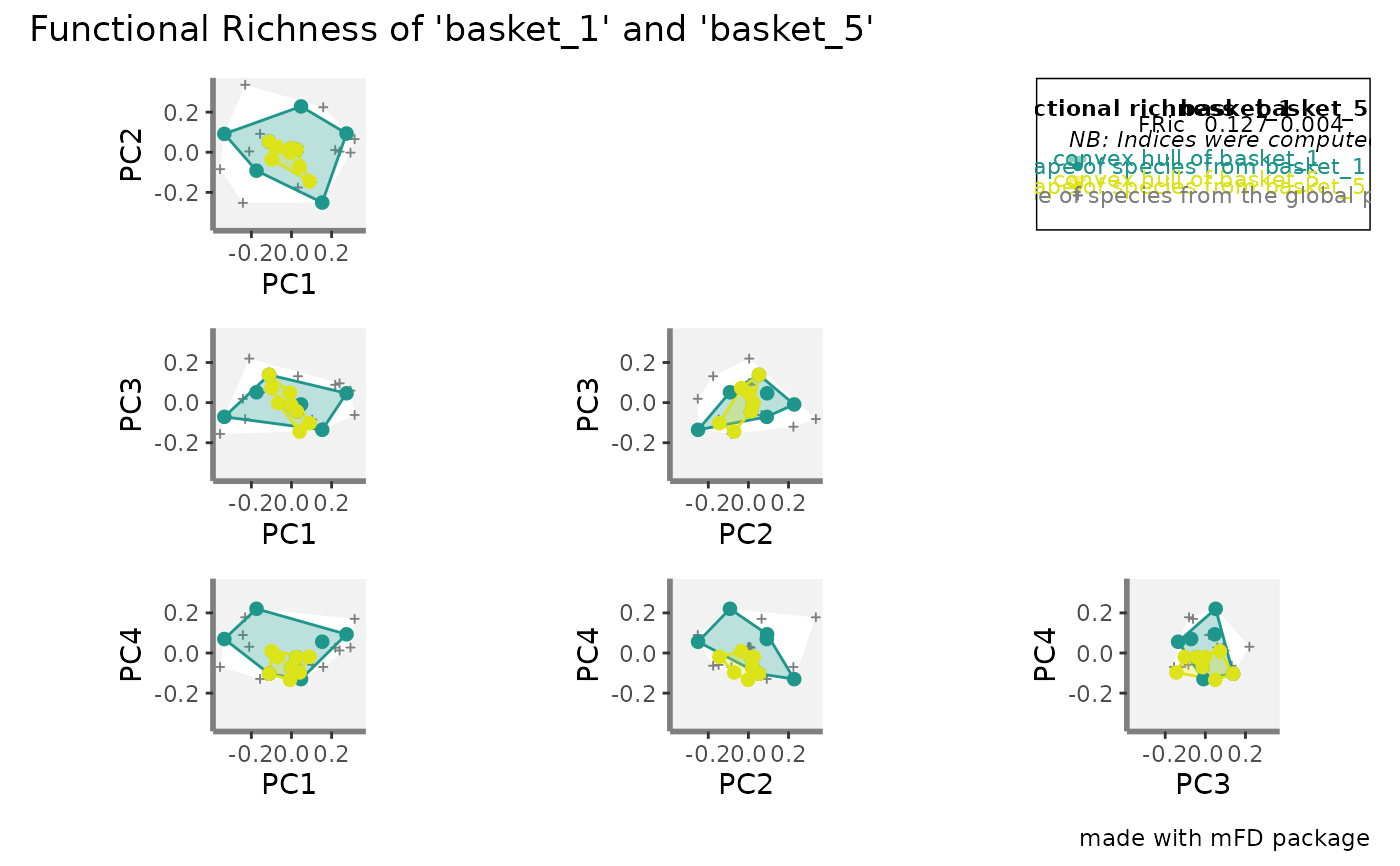
# Plot all fd alpha indices:
plots_alpha <- mFD::alpha.multidim.plot(
output_alpha_fd_multidim = alpha_fd_indices_fruits,
plot_asb_nm = c("basket_1", "basket_5"),
ind_nm = c("fdis", "fide", "fnnd", "feve",
"fric", "fdiv", "fori",
"fspe"),
faxes = NULL,
faxes_nm = NULL,
range_faxes = c(NA, NA),
color_bg = "grey95",
shape_sp = c(pool = 3, asb1 = 21,
asb2 = 21),
size_sp = c(pool = 0.7, asb1 = 1,
asb2 = 1),
color_sp = c(pool = "grey50",
asb1 = "#1F968BFF",
asb2 = "#DCE319FF"),
color_vert = c(pool = "grey50",
asb1 = "#1F968BFF",
asb2 = "#DCE319FF"),
fill_sp = c(pool = NA,
asb1 = "#1F968BFF",
asb2 = "#DCE319FF"),
fill_vert = c(pool = NA,
asb1 = "#1F968BFF",
asb2 = "#DCE319FF"),
color_ch = c(pool = NA,
asb1 = "#1F968BFF",
asb2 = "#DCE319FF"),
fill_ch = c(pool = "white",
asb1 = "#1F968BFF",
asb2 = "#DCE319FF"),
alpha_ch = c(pool = 1, asb1 = 0.3,
asb2 = 0.3),
shape_centroid_fdis = c(asb1 = 22, asb2 = 24),
shape_centroid_fdiv = c(asb1 = 22, asb2 = 24),
shape_centroid_fspe = 23,
color_centroid_fspe = "black",
size_sp_nm = 3,
color_sp_nm = "black",
plot_sp_nm = NULL,
fontface_sp_nm = "plain",
save_file = FALSE,
check_input = TRUE)
# Check FRic plot:
plots_alpha$fric$patchwork
 # }
# }