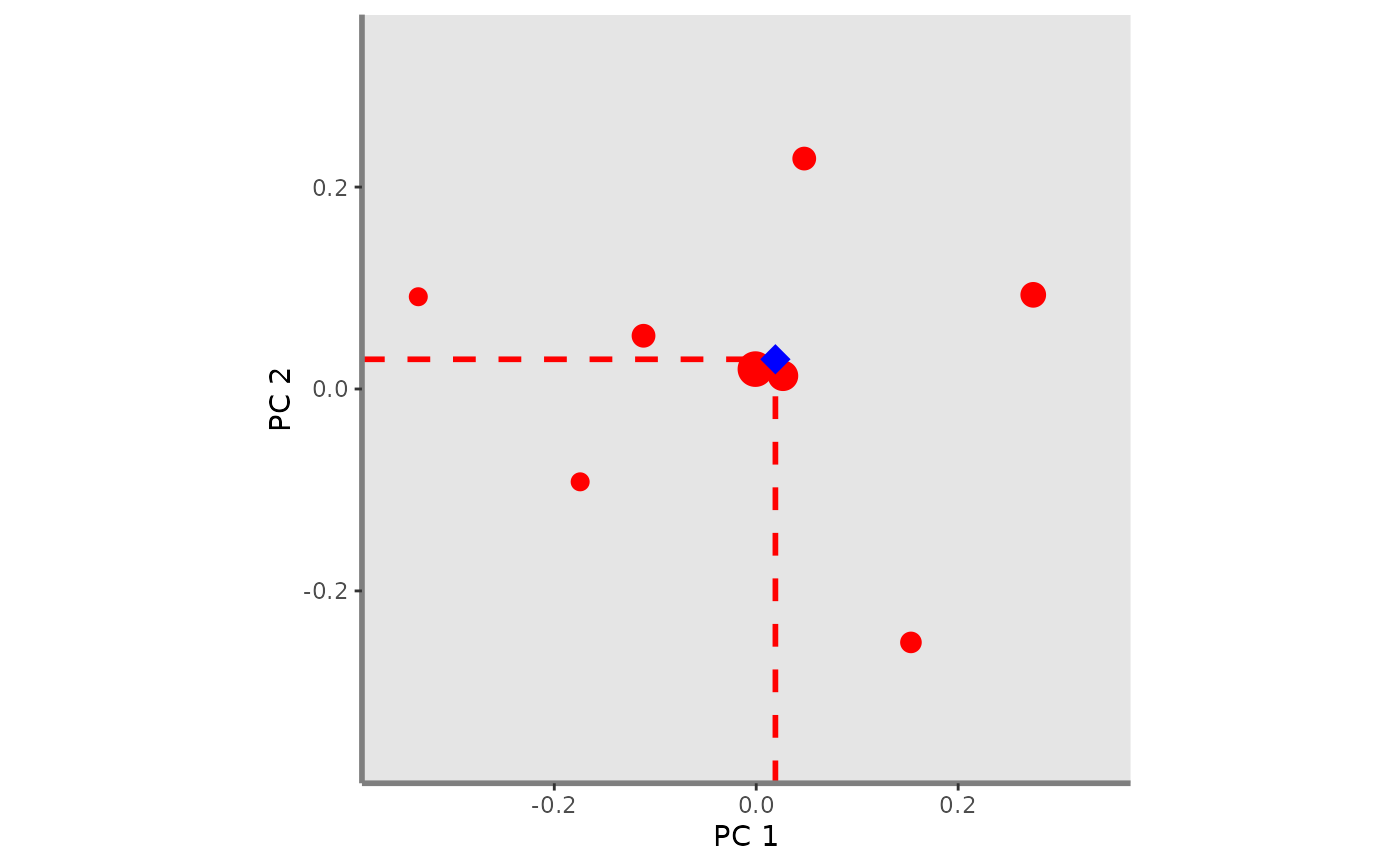
Plot FIde index given a pair of functional axes for one or several assemblages. It adds the centroid of species for each assemblage and segments showing centroid coordinates on functional axes on the background plot.
Usage
fide.plot(
  ggplot_bg,
  asb_sp_coord2D,
  asb_sp_relatw,
  asb_fide_coord2D,
  plot_sp = TRUE,
  shape_sp,
  color_sp,
  fill_sp,
  shape_fide,
  size_fide,
  color_fide,
  fill_fide,
  color_segment,
  width_segment,
  linetype_segment
)
Arguments
- ggplot_bg
a ggplot object of the plot background retrieved through the
background.plotfunction.- asb_sp_coord2D
a list of matrix (ncol = 2) with coordinates of species present in each assemblage for a given pair of functional axes.
- asb_sp_relatw
a list of vector gathering species relative weight in each assemblage. It can be retrieved through the
alpha.fd.multidim.- asb_fide_coord2D
a list (with names as in asb_sp_coord2D) of vectors with coordinates of the centroid of species for each assemblage for a given pair of axes.
- plot_sp
a logical value indicating whether species of each assemblage should be plotted or not. Default:
plot_sp = TRUE- shape_sp
a numeric value referring to the shape of the symbol used for species plotting if one assemblage to plot or a vector numeric values if several assemblages to plot. If more than one assemblage to plot, the vector should be formatted as: c(asb1 = "firstRshape", asb2 = "secondRshape", ...).
- color_sp
a R color name or an hexadecimal code referring to the color of species if one assemblage to plot or a vector of R color names or hexadecimal codes if several assemblages to plot. If more than one assemblage to plot, the vector should be formatted as: c(asb1 = "firstRcolorname", asb2 = "secondRcolorname", ...).
- fill_sp
a R color name or an hexadecimal code referring to the color of species symbol filling (if
shape_sp> 20) if one assemblage to plot or a vector of R color names or hexadecimal codes if several assemblages to plot. If more than one assemblage to plot, the vector should be formatted as: c(asb1 = "firstRcolorname", asb2 = "secondRcolorname", ...).- shape_fide
a numeric value referring to the shape of the symbol used for fide centroid plotting if one assemblage to plot or a vector numeric values if several assemblages to plot. If more than one assemblage to plot, the vector should be formatted as: c(asb1 = "firstRshape", asb2 = "secondRshape", ...).
- size_fide
a numeric value referring to the size of the symbol used for fide centroid plotting if one assemblage to plot or a vector numeric values if several assemblages to plot. If more than one assemblage to plot, the vector should be formatted as: c(asb1 = "firstRsize", asb2 = "secondRsize", ...).
- color_fide
a R color name or an hexadecimal code referring to the color of species centroid for agiven assemblage if one assemblage to plot or a vector of R color names or hexadecimal codes if several assemblages to plot. If more than one assemblage to plot, the vector should be formatted as: c(asb1 = "firstRcolorname", asb2 = "secondRcolorname", ...).
- fill_fide
a R color name or an hexadecimal code referring to the color to fill assemblage centroid symbol (if
shape_sp> 20) if one assemblage to plot or a vector of R color names or hexadecimal codes if several assemblages to plot. If more than one assemblage to plot, the vector should be formatted as: c(asb1 = "firstRcolorname", asb2 = "secondRcolorname", ...).- color_segment
a R color name or an hexadecimal code referring to the color of of the segment linking axes and centroid from the studied assemblage if one assemblage to plot or a vector of R color names or hexadecimal codes if several assemblages to plot. If more than one assemblage to plot, the vector should be formatted as: c(asb1 = "firstRcolorname", asb2 = "secondRcolorname", ...).
- width_segment
a numeric value referring to the width of the segment linking fide centroid and functional axes if one assemblage to plot or a vector numeric values if several assemblages to plot. If more than one assemblage to plot, the vector should be formatted as: c(asb1 = "firstRsize", asb2 = "secondRsize", ...).
- linetype_segment
a numeric value referring to the linetype of the segment linking fide centroid and functional axes if one assemblage to plot or a vector numeric values if several assemblages to plot. If more than one assemblage to plot, the vector should be formatted as: c(asb1 = "firstRlinetype", asb2 = "secondRlinetype", ...).
Examples
# Load Species*Traits dataframe:
data("fruits_traits", package = "mFD")

# Load Assemblages*Species dataframe:
data("baskets_fruits_weights", package = "mFD")

# Load Traits categories dataframe:
data("fruits_traits_cat", package = "mFD")

# Compute functional distance
sp_dist_fruits <- mFD::funct.dist(sp_tr         = fruits_traits,
                                  tr_cat        = fruits_traits_cat,
                                  metric        = "gower",
                                  scale_euclid  = "scale_center",
                                  ordinal_var   = "classic",
                                  weight_type   = "equal",
                                  stop_if_NA    = TRUE)
#> [1] "Running w.type=equal on groups=c(Size)"
#> [1] "Running w.type=equal on groups=c(Plant)"
#> [1] "Running w.type=equal on groups=c(Climate)"
#> [1] "Running w.type=equal on groups=c(Seed)"
#> [1] "Running w.type=equal on groups=c(Sugar)"
#> [1] "Running w.type=equal on groups=c(Use,Use,Use)"

# Compute functional spaces quality to retrieve species coordinates matrix:
fspaces_quality_fruits <- mFD::quality.fspaces(sp_dist = sp_dist_fruits,
 maxdim_pcoa         = 10,
 deviation_weighting = "absolute",
 fdist_scaling       = FALSE,
 fdendro             = "average")

# Retrieve species coordinates matrix:
sp_faxes_coord_fruits <- fspaces_quality_fruits$details_fspaces$sp_pc_coord

# Set faxes limits:
# set range of axes if c(NA, NA):
 range_sp_coord_fruits  <- range(sp_faxes_coord_fruits)
 range_faxes_lim <- range_sp_coord_fruits +
 c(-1, 1)*(range_sp_coord_fruits[2] -
 range_sp_coord_fruits[1]) * 0.05

 # Retrieve the background plot:
 ggplot_bg_fruits <- mFD::background.plot(
                               range_faxes = range_faxes_lim,
                               faxes_nm    = c("PC 1", "PC 2"),
                               color_bg    = "grey90")

 # Retrieve the matrix of species coordinates for "basket_1" and PC1 and PC2
 sp_filter <- mFD::sp.filter(asb_nm          = "basket_1",
                             sp_faxes_coord = sp_faxes_coord_fruits,
                             asb_sp_w       = baskets_fruits_weights)
 fruits_asb_sp_coord_b1 <- sp_filter$`species coordinates`
 fruits_asb_sp_coord2D_b1 <- fruits_asb_sp_coord_b1[, c("PC1", "PC2")]

 # Use alpha.fd.multidim() function to get inputs to plot FIde:
 alpha_fd_indices_fruits <- mFD::alpha.fd.multidim(
 sp_faxes_coord    = sp_faxes_coord_fruits[, c("PC1", "PC2", "PC3", "PC4")],
  asb_sp_w         = baskets_fruits_weights,
  ind_vect         = c("fide"),
  scaling          = TRUE,
  check_input      = TRUE,
  details_returned = TRUE)
#> basket_1 done 10%
#> basket_2 done 20%
#> basket_3 done 30%
#> basket_4 done 40%
#> basket_5 done 50%
#> basket_6 done 60%
#> basket_7 done 70%
#> basket_8 done 80%
#> basket_9 done 90%
#> basket_10 done 100%

 # Retrieve fide values through alpha.fd.multidim outputs:
 fruits_asb_fide_coord2D <-
  alpha_fd_indices_fruits$functional_diversity_indices[c("fide_PC1",
                                                         "fide_PC2")]
 fruits_asb_fide_coord2D_b1 <- fruits_asb_fide_coord2D[c("basket_1"), ]
 fruits_asb_sp_relatw_b1 <-
         alpha_fd_indices_fruits$details$asb_sp_relatw["basket_1", ]

 # Retrieve FIde plot:
 fide_plot <- fide.plot(ggplot_bg = ggplot_bg_fruits,
           asb_sp_coord2D = list(basket_1 = fruits_asb_sp_coord2D_b1),
           asb_sp_relatw = list(basket_1 = fruits_asb_sp_relatw_b1),
           asb_fide_coord2D = list(basket_1 = fruits_asb_fide_coord2D_b1),
           plot_sp = TRUE,
           shape_sp = 16,
           color_sp = "red",
           fill_sp = "red",
           shape_fide = list(basket_1 = 18),
           size_fide = list(basket_1 = 5),
           color_fide = list(basket_1 = "blue"),
           fill_fide = list(basket_1 = "blue"),
           color_segment = list(basket_1 = "red"),
           width_segment = list(basket_1 = 1),
           linetype_segment = list(basket_1 = "dashed"))

 fide_plot