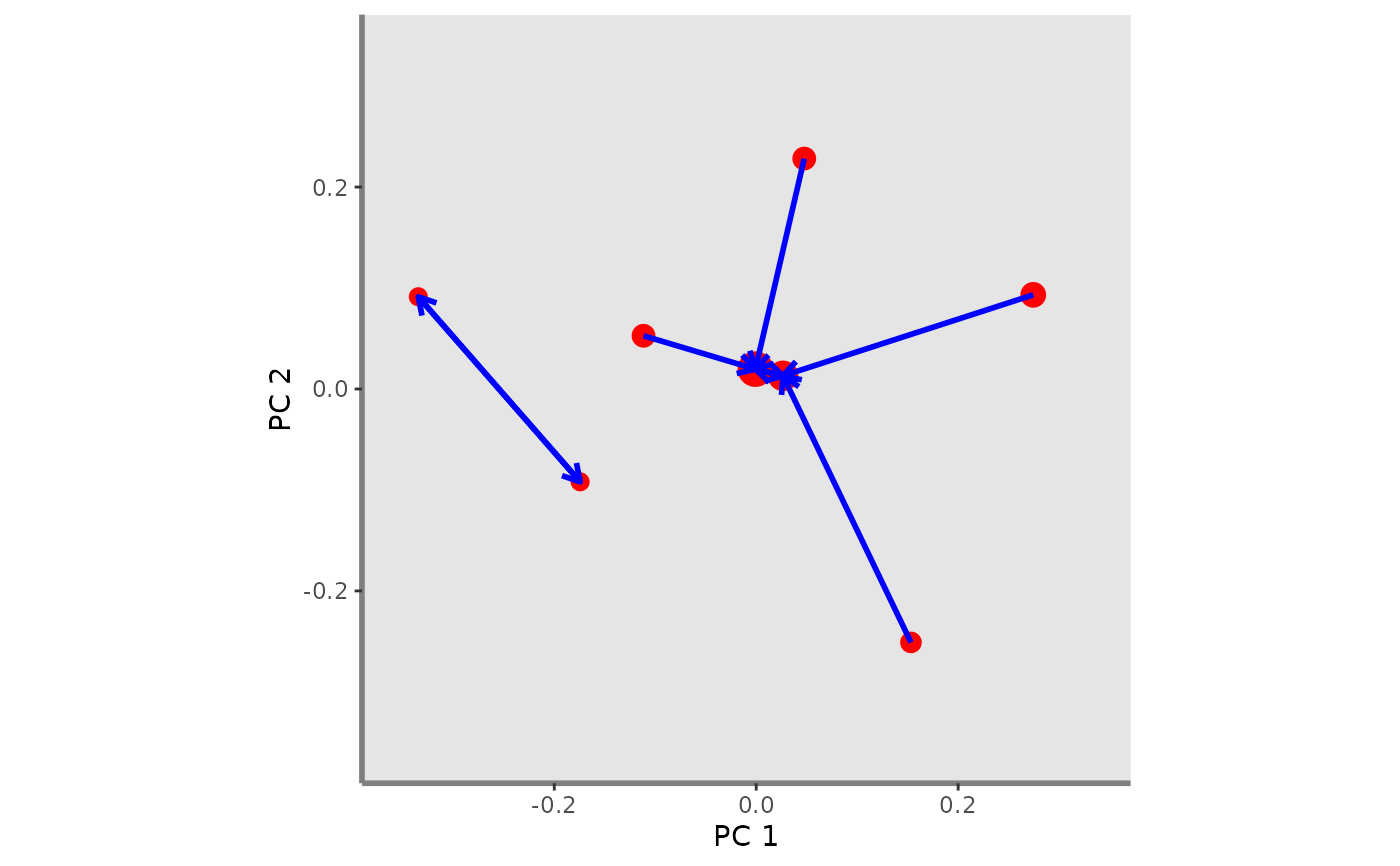
This function plots FNND index for a given pair of functional axes and for one or several assemblages
Usage
fnnd.plot(
  ggplot_bg,
  asb_sp_coord2D,
  asb_sp_relatw,
  asb_nn_asb,
  plot_sp = TRUE,
  shape_sp,
  color_sp,
  fill_sp,
  color_segment,
  width_segment,
  linetype_segment
)
Arguments
- ggplot_bg
a ggplot object of the plot background retrieved through the
background.plotfunction.- asb_sp_coord2D
a list of matrix (ncol = 2) with coordinates of species present in each assemblage for a given pair of functional axes
- asb_sp_relatw
a list of vector gathering species relative weight in each assemblage. It can be retrieved through the
alpha.fd.multidim.- asb_nn_asb
a list gathering for each species of a studied assemblage its nearest neighbour(s) in the assemblage.
- plot_sp
a logical value indicating whether species of each assemblage should be plotted or not. Default:
plot_sp = TRUE- shape_sp
a numeric value referring to the shape used to plot species belonging to the studied assemblage.
- color_sp
a R color name or an hexadecimal code referring to the color of species if one assemblage to plot or a vector of R color names or hexadecimal codes if several assemblages to plot. If more than one assemblage to plot, the vector should be formatted as: c(asb1 = "firstRcolorname", asb2 = "secondRcolorname", ...).
- fill_sp
a R color name or an hexadecimal code referring to the color of species symbol filling (if
shape_sp> 20) if one assemblage to plot or a vector of R color names or hexadecimal codes if several assemblages to plot. If more than one assemblage to plot, the vector should be formatted as: c(asb1 = "firstRcolorname", asb2 = "secondRcolorname", ...).- color_segment
a R color name or an hexadecimal code referring to the color of of the segment linking nearest neighbors in a given assemblage or a vector of R color names or hexadecimal codes if several assemblages to plot. If more than one assemblage to plot, the vector should be formatted as: c(asb1 = "firstRcolorname", asb2 = "secondRcolorname", ...).
- width_segment
a numeric value referring to the size of the segment linking nearest neighbors in a given assemblage or a vector of numeric values if several assemblages to plot. If more than one assemblage to plot, the vector should be formatted as: c(asb1 = "firstRwidth", asb2 = "secondRwidth", ...).
- linetype_segment
a character string referring to the linetype used to link nearest neighbors in the studied assemblages or a vector of character strings if several assemblages to plot. If more than one assemblage to plot, the vector should be formatted as: c(asb1 = "firstRlinetype", asb2 = "secondRlinetype", ...).
Examples
# Load Species*Traits dataframe:
data("fruits_traits", package = "mFD")

# Load Assemblages*Species dataframe:
data("baskets_fruits_weights", package = "mFD")

# Load Traits categories dataframe:
data("fruits_traits_cat", package = "mFD")

# Compute functional distance
sp_dist_fruits <- mFD::funct.dist(sp_tr         = fruits_traits,
                                  tr_cat        = fruits_traits_cat,
                                  metric        = "gower",
                                  scale_euclid  = "scale_center",
                                  ordinal_var   = "classic",
                                  weight_type   = "equal",
                                  stop_if_NA    = TRUE)
#> [1] "Running w.type=equal on groups=c(Size)"
#> [1] "Running w.type=equal on groups=c(Plant)"
#> [1] "Running w.type=equal on groups=c(Climate)"
#> [1] "Running w.type=equal on groups=c(Seed)"
#> [1] "Running w.type=equal on groups=c(Sugar)"
#> [1] "Running w.type=equal on groups=c(Use,Use,Use)"

# Compute functional spaces quality to retrieve species coordinates matrix:
fspaces_quality_fruits <- mFD::quality.fspaces(sp_dist = sp_dist_fruits,
 maxdim_pcoa         = 10,
 deviation_weighting = "absolute",
 fdist_scaling       = FALSE,
 fdendro             = "average")

# Retrieve species coordinates matrix:
sp_faxes_coord_fruits <- fspaces_quality_fruits$details_fspaces$sp_pc_coord

# Set faxes limits:
# set range of axes if c(NA, NA):
 range_sp_coord_fruits  <- range(sp_faxes_coord_fruits)
 range_faxes_lim <- range_sp_coord_fruits +
 c(-1, 1)*(range_sp_coord_fruits[2] -
 range_sp_coord_fruits[1]) * 0.05

 # Retrieve the background plot:
 ggplot_bg_fruits <- mFD::background.plot(
                               range_faxes = range_faxes_lim,
                               faxes_nm    = c("PC 1", "PC 2"),
                               color_bg    = "grey90")

 # Retrieve the matrix of species coordinates for "basket_1" and PC1 and PC2
 sp_filter <- mFD::sp.filter(asb_nm          = "basket_1",
                             sp_faxes_coord = sp_faxes_coord_fruits,
                             asb_sp_w       = baskets_fruits_weights)
 fruits_asb_sp_coord_b1 <- sp_filter$`species coordinates`
 fruits_asb_sp_coord2D_b1 <- fruits_asb_sp_coord_b1[, c("PC1", "PC2")]

 # Use alpha.fd.multidim() function to get inputs to plot FIde:
 alpha_fd_indices_fruits <- mFD::alpha.fd.multidim(
  sp_faxes_coord   = sp_faxes_coord_fruits[, c("PC1", "PC2", "PC3", "PC4")],
  asb_sp_w         = baskets_fruits_weights,
  ind_vect         = c("fnnd"),
  scaling          = TRUE,
  check_input      = TRUE,
  details_returned = TRUE)
#> basket_1 done 10%
#> basket_2 done 20%
#> basket_3 done 30%
#> basket_4 done 40%
#> basket_5 done 50%
#> basket_6 done 60%
#> basket_7 done 70%
#> basket_8 done 80%
#> basket_9 done 90%
#> basket_10 done 100%

 # Retrieve nearest neighbor(s) names and relative weights ...
 # ... through alpha.fd.multidim outputs:
 fruits_asb_nn_asb_b1 <-
         alpha_fd_indices_fruits$details$asb_nm_nn_asb["basket_1"]
 fruits_asb_sp_relatw_b1 <-
         alpha_fd_indices_fruits$details$asb_sp_relatw["basket_1", ]

 # Retrieve FNND plot:
 fnnd_plot <- fnnd.plot(ggplot_bg = ggplot_bg_fruits,
           asb_sp_coord2D = list(basket_1 = fruits_asb_sp_coord2D_b1),
           asb_sp_relatw = list(basket_1 = fruits_asb_sp_relatw_b1),
           asb_nn_asb = fruits_asb_nn_asb_b1 ,
           plot_sp = TRUE,
           shape_sp = 16,
           color_sp = "red",
           fill_sp = "red",
           color_segment = list(basket_1 = "blue"),
           width_segment = list(basket_1 = 1),
           linetype_segment = list(basket_1 = "solid"))

 fnnd_plot