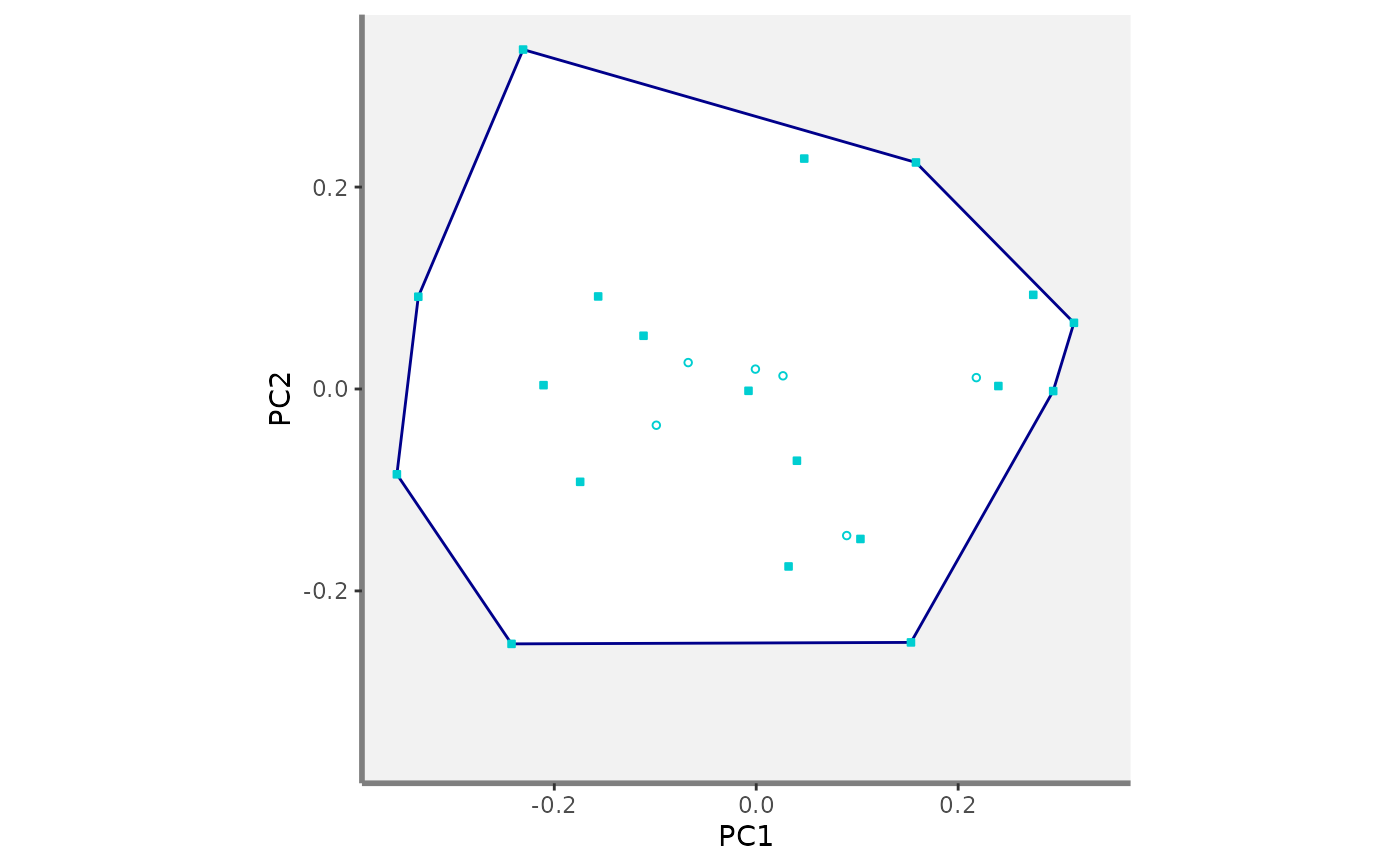
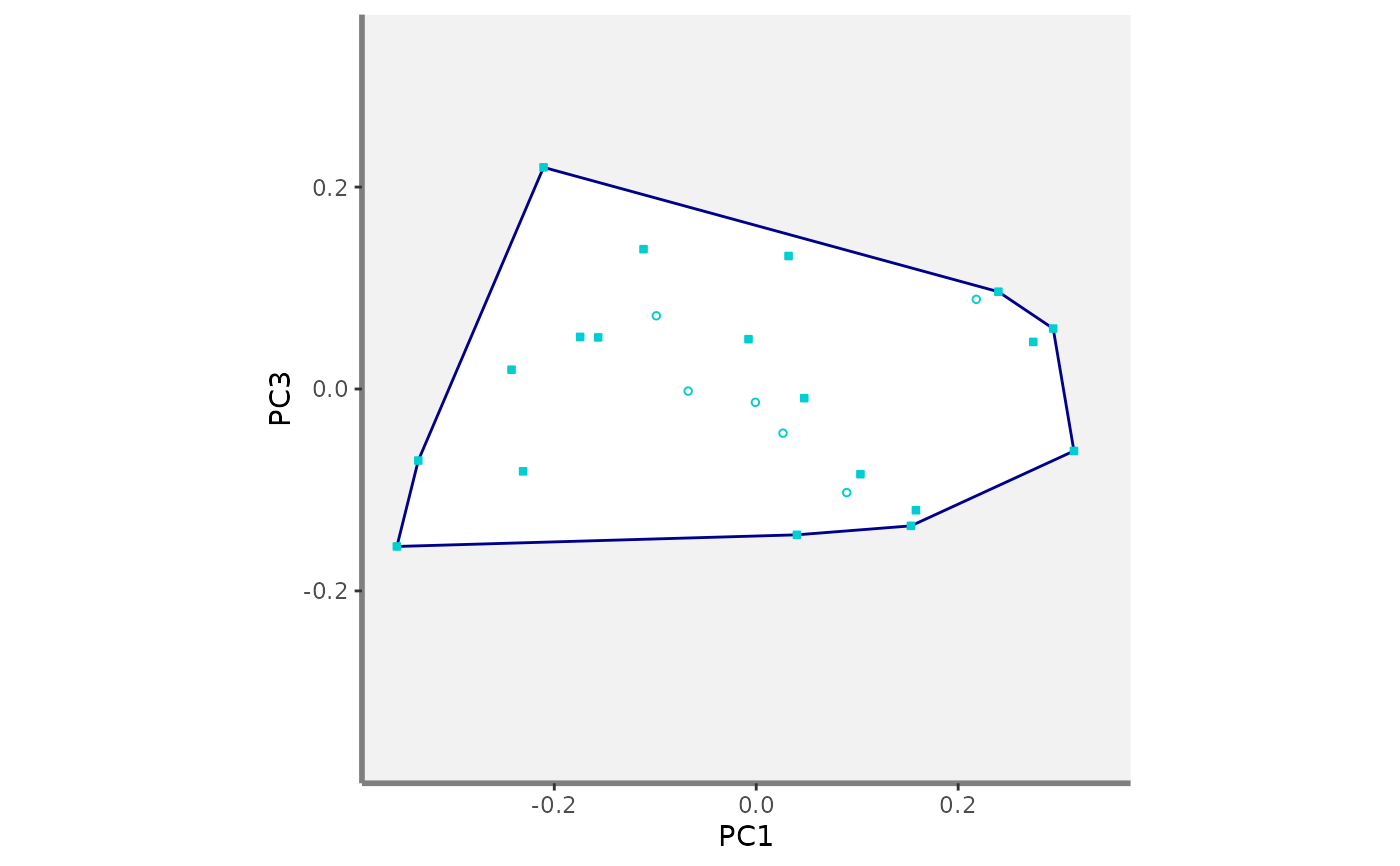
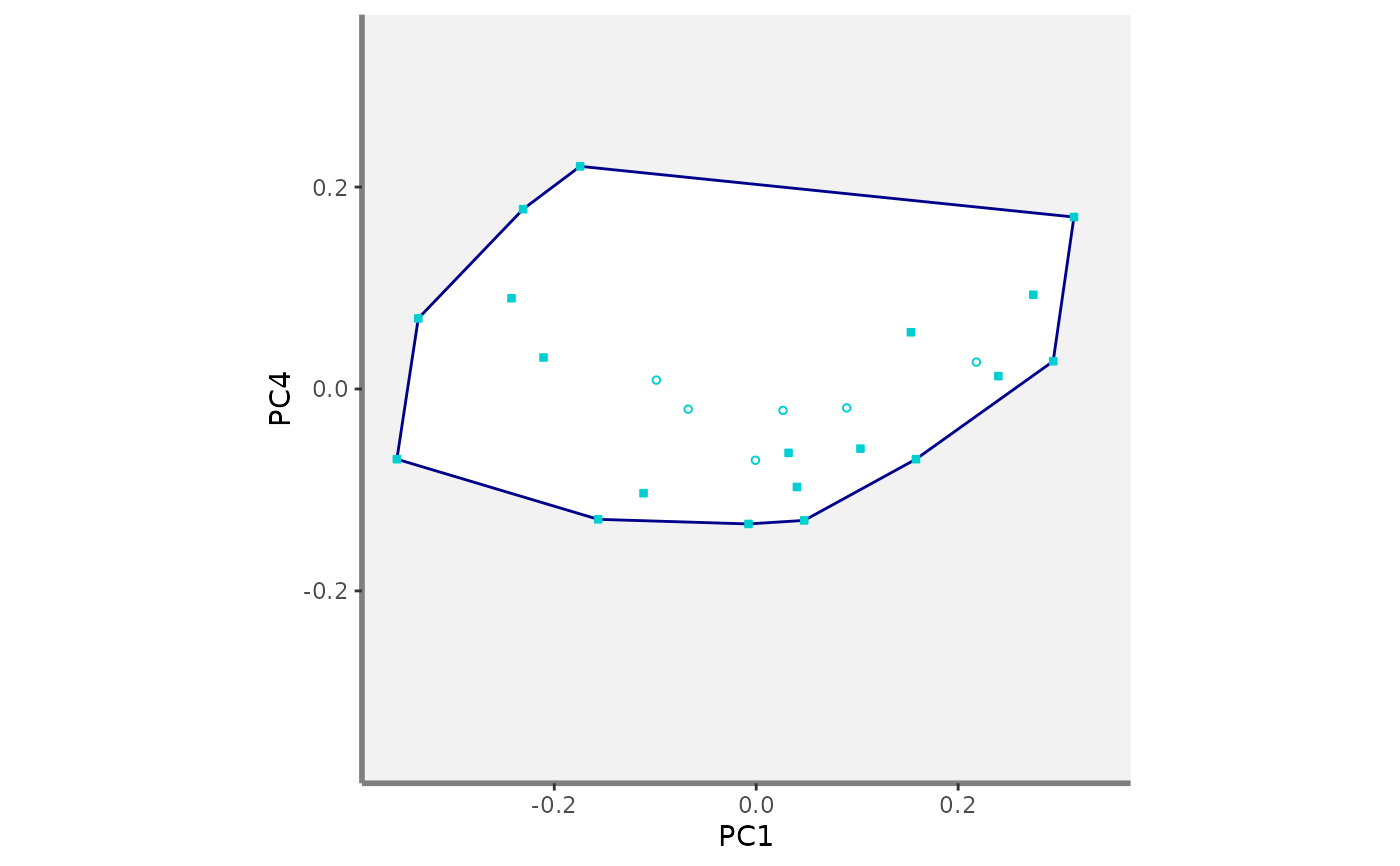
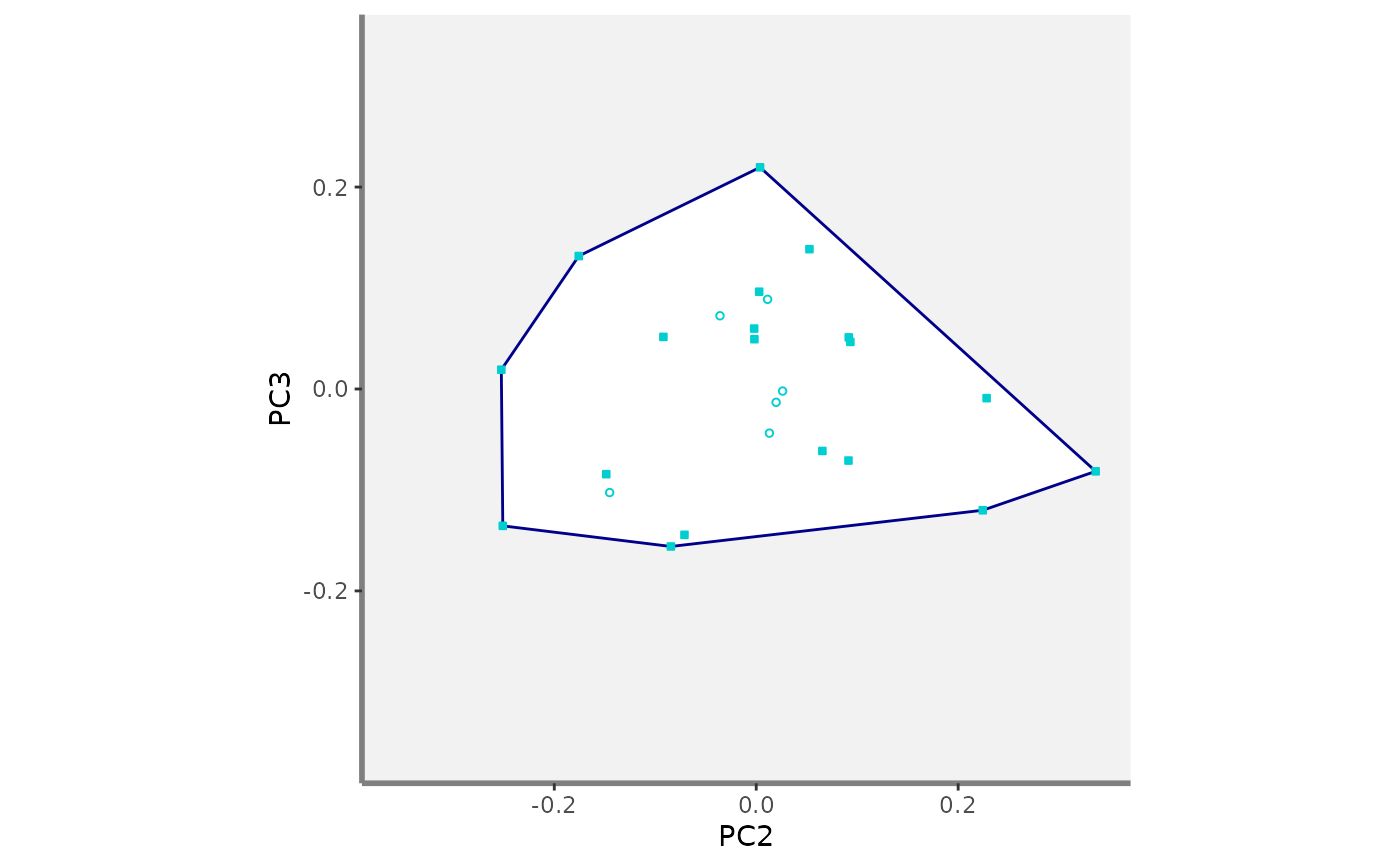
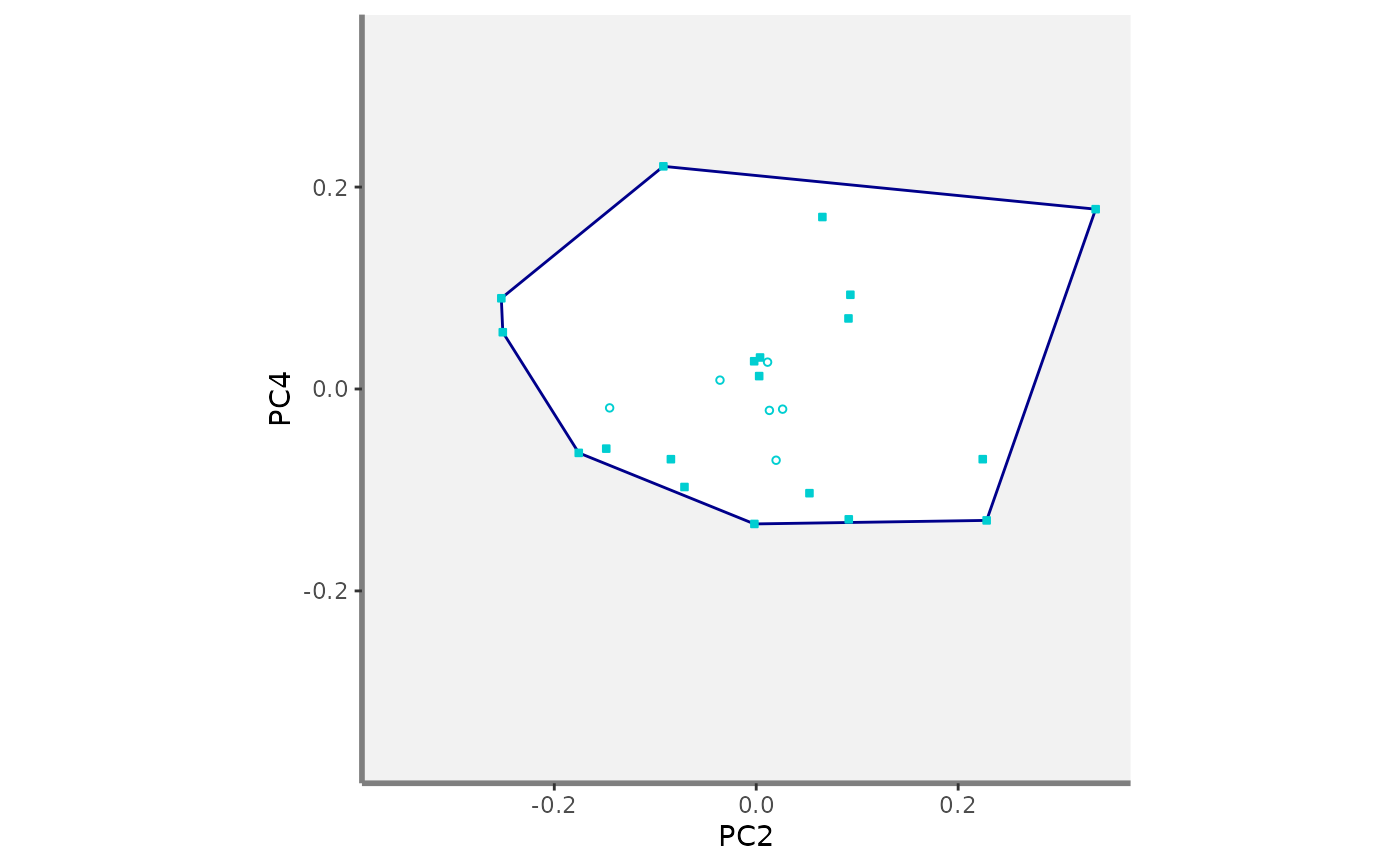
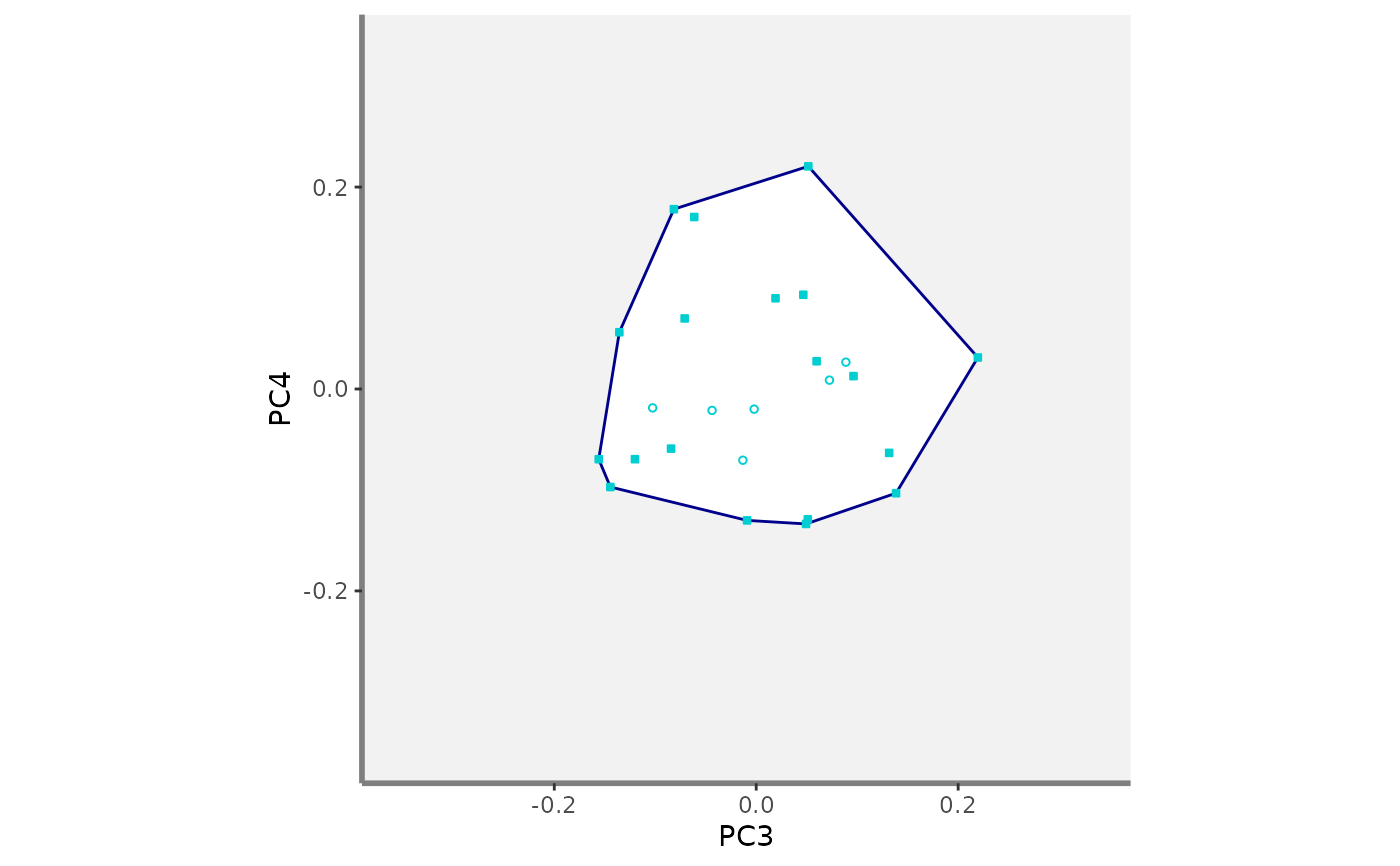
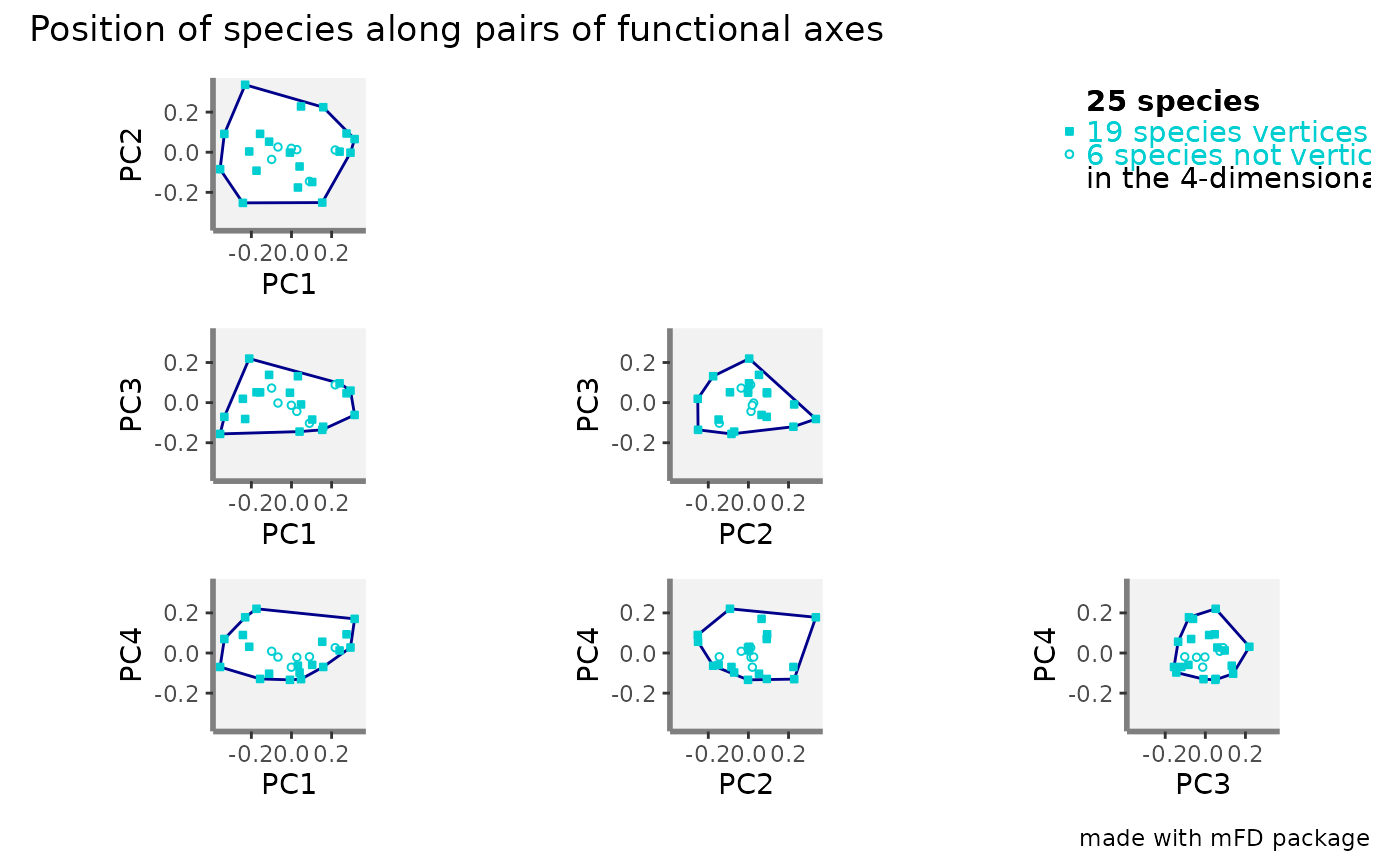
This function illustrates the position of species along pairs of axes of a functional space
Usage
funct.space.plot(
  sp_faxes_coord,
  faxes = NULL,
  name_file = NULL,
  faxes_nm = NULL,
  range_faxes = c(NA, NA),
  color_bg = "grey95",
  color_pool = "darkturquoise",
  fill_pool = "white",
  shape_pool = 21,
  size_pool = 1,
  plot_ch = TRUE,
  color_ch = "darkblue",
  fill_ch = "white",
  alpha_ch = 1,
  plot_vertices = TRUE,
  color_vert = "darkturquoise",
  fill_vert = "darkturquoise",
  shape_vert = 22,
  size_vert = 1,
  plot_sp_nm = NULL,
  nm_size = 3,
  nm_color = "black",
  nm_fontface = "plain",
  check_input = TRUE
)
Arguments
- sp_faxes_coord
a matrix of species coordinates in a multidimensional functional space. Species coordinates have been retrieved thanks to
tr.cont.fspaceorquality.fspaces.- faxes
a vector with names of axes to plot (as columns names in
sp_faxes_coord). You can only plot from 2 to 4 axes for graphical reasons. Default:faxes = NULL(the four first axes will be plotted).- name_file
a character string with name of file to save the figure (without extension). Default:
name_file = NULLwhich means plot is displayed.- faxes_nm
a vector with axes labels for figure. Default: as
faxes).- range_faxes
a vector with minimum and maximum values of axes used for all plots to have a fair representation of position of species. Default:
range_faxes = c(NA, NA)(the range is computed according to the range of values among all axes). If at least one of the value provided is within the range of coordinates, then convex hull could not be plotted soplot_chshould beFALSE.- color_bg
a R color name or an hexadecimal code used to fill plot background. Default:
color_bg = "grey95".- color_pool
a R color name or an hexadecimal code referring to the color of symbol for species. Default:
color_pool = 'darkgreen'.- fill_pool
a R color name or an hexadecimal code referring to the color to fill species symbol (if
shape_pool>20). Default:fill_pool = 'white'.- shape_pool
a numeric value referring to the shape of symbol used for species. Default:
shape_pool = 21(filled circle).- size_pool
a numeric value referring to the size of symbol for species. Default:
size_pool = 1.- plot_ch
a logical value indicating whether the convex hull shaping the pool of species should be illustrated. If
plot_ch = TRUE, convex hull of all species in the multidimensional space described insp_faxes_coordis computed and its projection in 2D spaces are drawn as polygons. Default:plot_ch = TRUE.- color_ch
a R color name or an hexadecimal code referring to the border of the convex hull filled by the pool of species. Default:
color_ch = "darkblue".- fill_ch
a R color name or an hexadecimal code referring to the filling of the convex hull filled by the pool of species. Default:
fill_ch = "white".- alpha_ch
a numeric value for transparency of the filling of the convex hull (0 = high transparency, 1 = no transparency). Default:
alpha_ch = 1.- plot_vertices
a logical value defining whether vertices of the convex hull shaping the pool of species should be illustrated. If
plot_vertices = TRUE, vertices of convex hull computed in the multidimensional space fromsp_faxes_coordand are plotted with aesthetics listed below '..._vert' (species not being vertices are plotted with aesthetics described above for '.._sp'. Default:plot_vertices = TRUE.- color_vert
a character value referring to the color of symbol for vertices if
plot_vertices = TRUE. Default:color_vert = 'darkturquoise'.- fill_vert
a character value referring to the color for filling symbol for vertices (if
shape_vert>20). Default:fill_vert = 'darkturquoise'.- shape_vert
a numeric value referring to the symbol used to show vertices position if
plot_vertices = TRUE. Default:shape_vert = 23(filled diamond).- size_vert
a numeric value referring to the size of symbol for vertices Default:
size_vert = 1.- plot_sp_nm
a vector containing species names that are to be printed near their position. Default:
plot_nm_sp = NULL(no name plotted).- nm_size
a numeric value for size of species label. Default is
3(in points).- nm_color
a R color name or an hexadecimal code referring to the color of species label. Default:
nm_color = 'black'.- nm_fontface
a character string for font of species labels (e.g. "italic", "bold"). Default:
nm_fontface = 'plain'.- check_input
a logical value indicating whether key features the inputs are checked (e.g. class and/or mode of objects, names of rows and/or columns, missing values). If an error is detected, a detailed message is returned. Default:
check_input = TRUE.
Value
If name_file is NULL, a list containing ggplot2
objects is returned: plots of functional space along all pairs of axes
(named according to axes names, e.g. "PC1_PC2"), figure 'caption', and the
full figure 'patchwork' built using the library patchwork.
If name_file is not NULL a 300dpi png file
is saved in the working directory. Ranges of axes are the same for all
panels and if required projection of the convex hull computed in the
multidimensional space provided as input sp_faxes_coord is
illustrated with a polygon. Species being vertices of this convex hull are
shown with aesthetics provided as inputs ..._vert. Labels for
species listed in plot_sp_nm are added with if required arrows
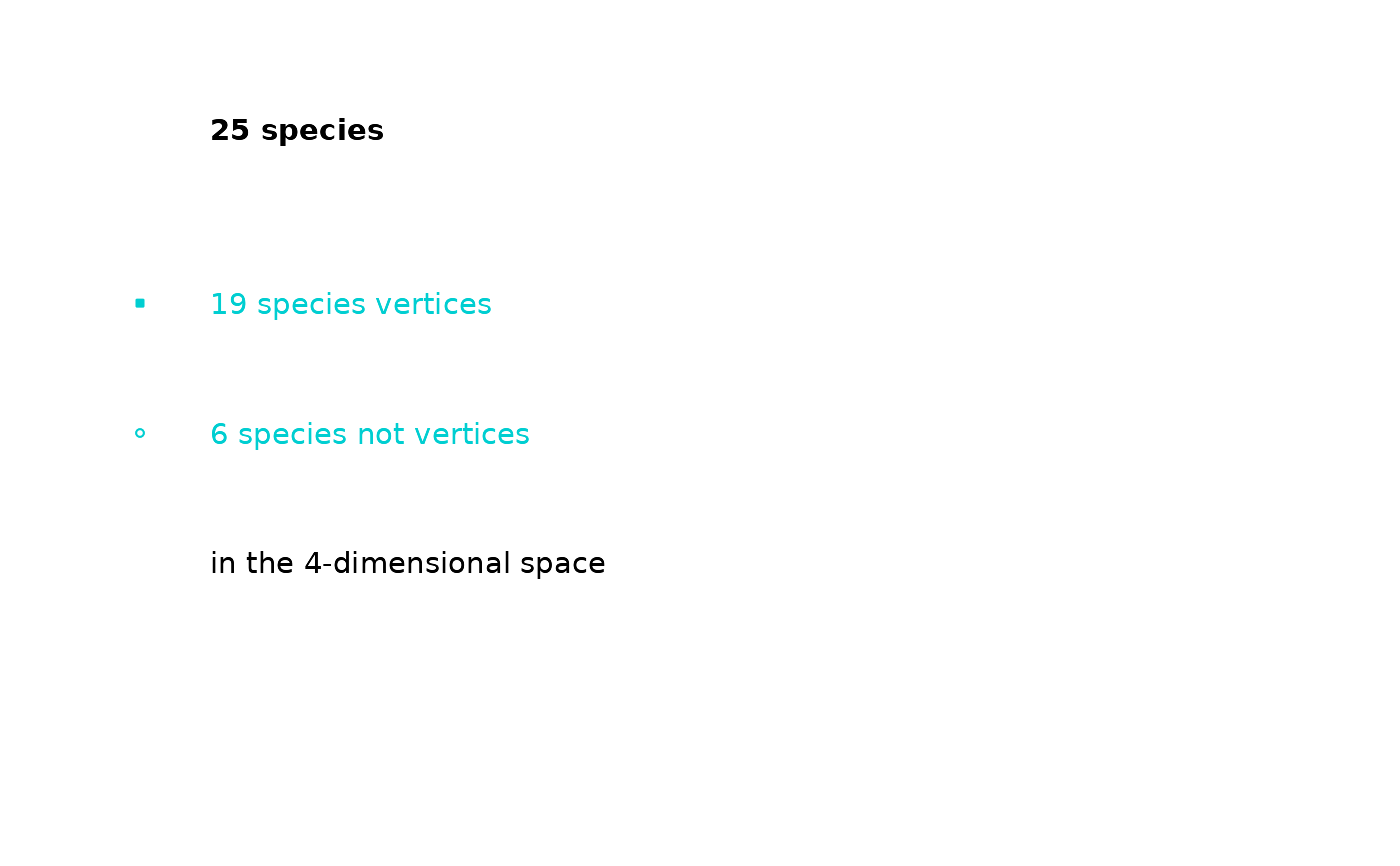
using ggrepel. Summary about species and dimensionality are printed
on top-right corner of the figure.
Examples
# Load Species*Traits dataframe:
data("fruits_traits", package = "mFD")
# Load Assemblages*Species dataframe:
data("baskets_fruits_weights", package = "mFD")
# Load Traits categories dataframe:
data("fruits_traits_cat", package = "mFD")
# Compute functional distance
sp_dist_fruits <- mFD::funct.dist(sp_tr = fruits_traits,
tr_cat = fruits_traits_cat,
metric = "gower",
scale_euclid = "scale_center",
ordinal_var = "classic",
weight_type = "equal",
stop_if_NA = TRUE)
#> [1] "Running w.type=equal on groups=c(Size)"
#> [1] "Running w.type=equal on groups=c(Plant)"
#> [1] "Running w.type=equal on groups=c(Climate)"
#> [1] "Running w.type=equal on groups=c(Seed)"
#> [1] "Running w.type=equal on groups=c(Sugar)"
#> [1] "Running w.type=equal on groups=c(Use,Use,Use)"
# Compute functional spaces quality to retrieve species coordinates matrix:
fspaces_quality_fruits <- mFD::quality.fspaces(
sp_dist = sp_dist_fruits,
maxdim_pcoa = 10,
deviation_weighting = "absolute",
fdist_scaling = FALSE,
fdendro = "average")
# Retrieve species coordinates matrix:
sp_faxes_coord_fruits <- fspaces_quality_fruits$details_fspaces$sp_pc_coord
# Plot functional spaces:
mFD::funct.space.plot(
sp_faxes_coord = sp_faxes_coord_fruits[, c("PC1", "PC2", "PC3", "PC4")],
faxes = NULL,
name_file = NULL,
faxes_nm = NULL,
range_faxes = c(NA, NA),
color_bg = "grey95",
color_pool = "darkturquoise",
fill_pool = "white",
shape_pool = 21,
size_pool = 1,
plot_ch = TRUE,
color_ch = "darkblue",
fill_ch = "white",
alpha_ch = 1,
plot_vertices = TRUE,
color_vert = "darkturquoise",
fill_vert = "darkturquoise",
shape_vert = 22,
size_vert = 1,
plot_sp_nm = NULL,
nm_size = 3,
nm_color = "black",
nm_fontface = "plain",
check_input = TRUE)
#> $PC1_PC2
 #>
#> $PC1_PC3
#>
#> $PC1_PC3
 #>
#> $PC1_PC4
#>
#> $PC1_PC4
 #>
#> $PC2_PC3
#>
#> $PC2_PC3
 #>
#> $PC2_PC4
#>
#> $PC2_PC4
 #>
#> $PC3_PC4
#>
#> $PC3_PC4
 #>
#> $caption
#>
#> $caption
 #>
#> $patchwork
#>
#> $patchwork
 #>
#>